
Record Profits, Borrowed From A Credit Cost Trough
Indian markets consolidated as oil stabilised following an Iran-US agreement and global flows stayed anchored in US chip…
June 2026
Our portfolio companies reported revenue growth of ~ 20% YoY during the quarter, ahead of the broader benchmark. Importantly, this growth continued to translate into stronger profitability, with portfolio-level gross margins tracking above benchmark levels for the last seven consecutive quarters.
This sustained margin outperformance, despite an uneven demand environment, highlights our focus on owning businesses that are able to convert incremental revenue into earnings through operating leverage and pricing power.
Portfolio Performance Overview:
Taken together, earnings delivery this quarter continues to reflect a pattern we have observed over the past few periods — growth remains concentrated in businesses with stronger pricing power and operating leverage. In an environment where demand recovery is uneven across segments, this distinction continues to play an important role in how we construct and position the portfolio.
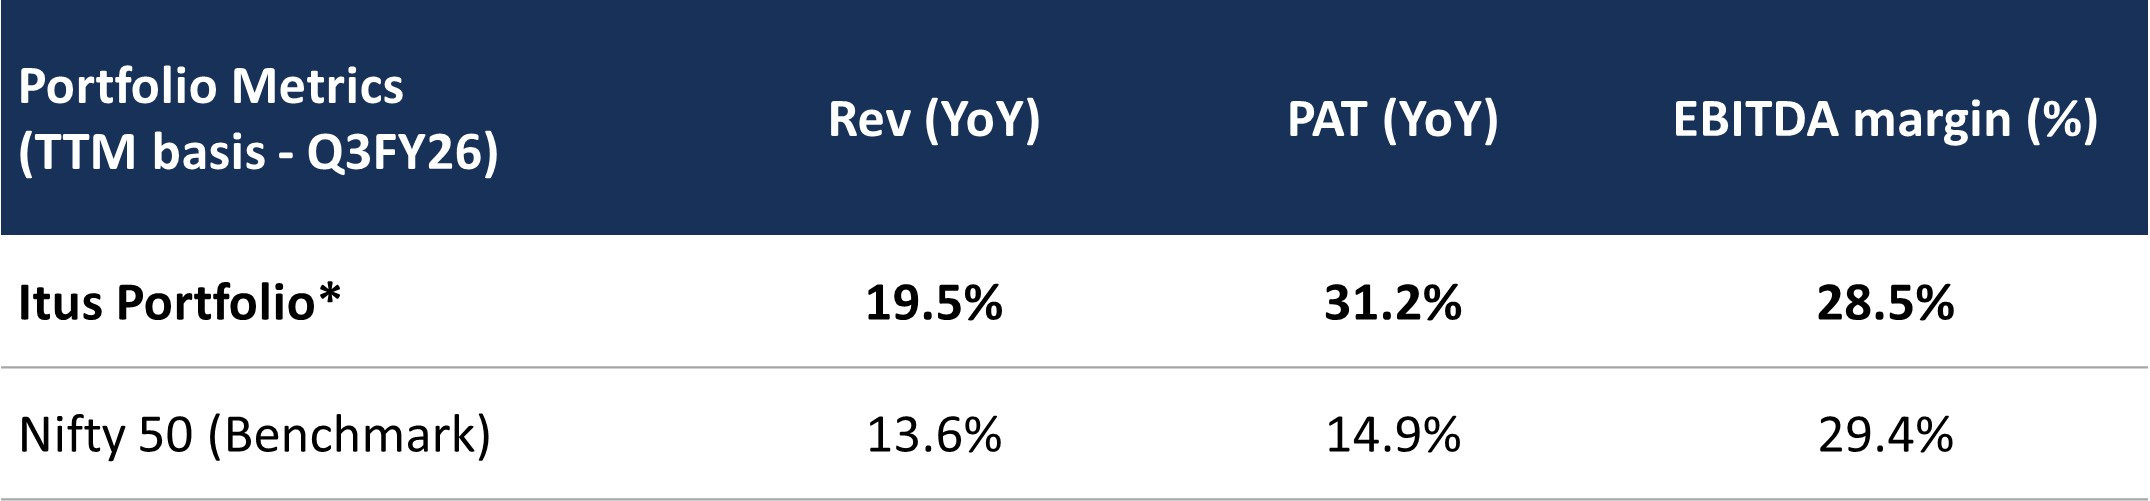
*PAT is adjusted for one of the portfolio companies which went through an operating deleverage due to inventory destocking Note: For year-on-year (YoY) comparisons, we have used a rolling four-quarter format – Q4FY25 to Q3FY26 compared with Q4FY24 to Q3FY25. The sum of portfolio weights would not total up to 100%; remaining would be our cash holdings.
Gross Margin Performance:
Over the past several quarters, portfolio-level gross margins have consistently remained above benchmark levels. This reflects our preference for businesses with either pricing power or fixed-cost absorption benefits, where incremental revenue growth translates into a disproportionate expansion in profitability.
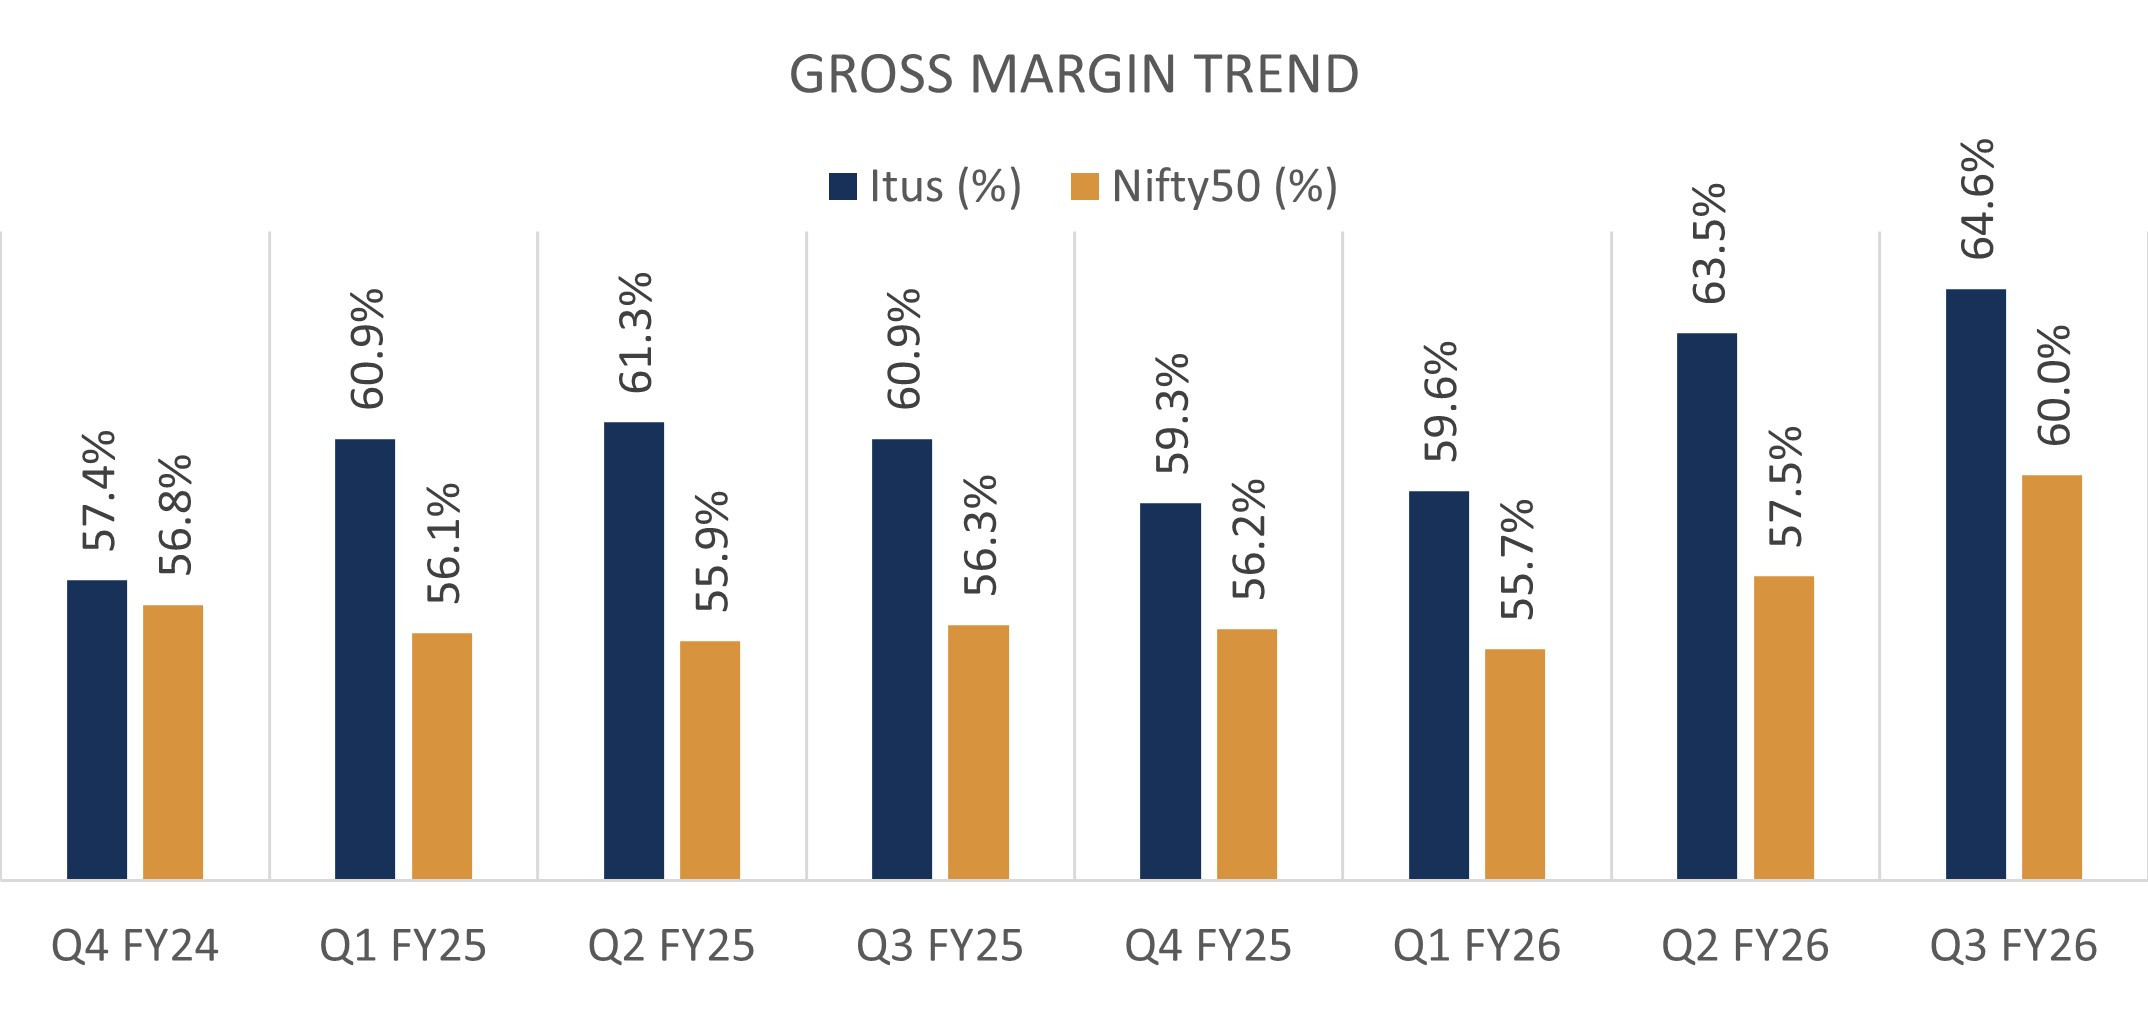
Exhibit 1: Gross Margins for Itus Portfolio over the last 8Q
Sector Exposure:
Sector exposure continues to reflect our preference for businesses where earnings visibility is supported by operating leverage, supply-side rationalization, or pricing power. Our overweight in sectors is driven by our assessment of relative earnings growth visibility over the medium term.
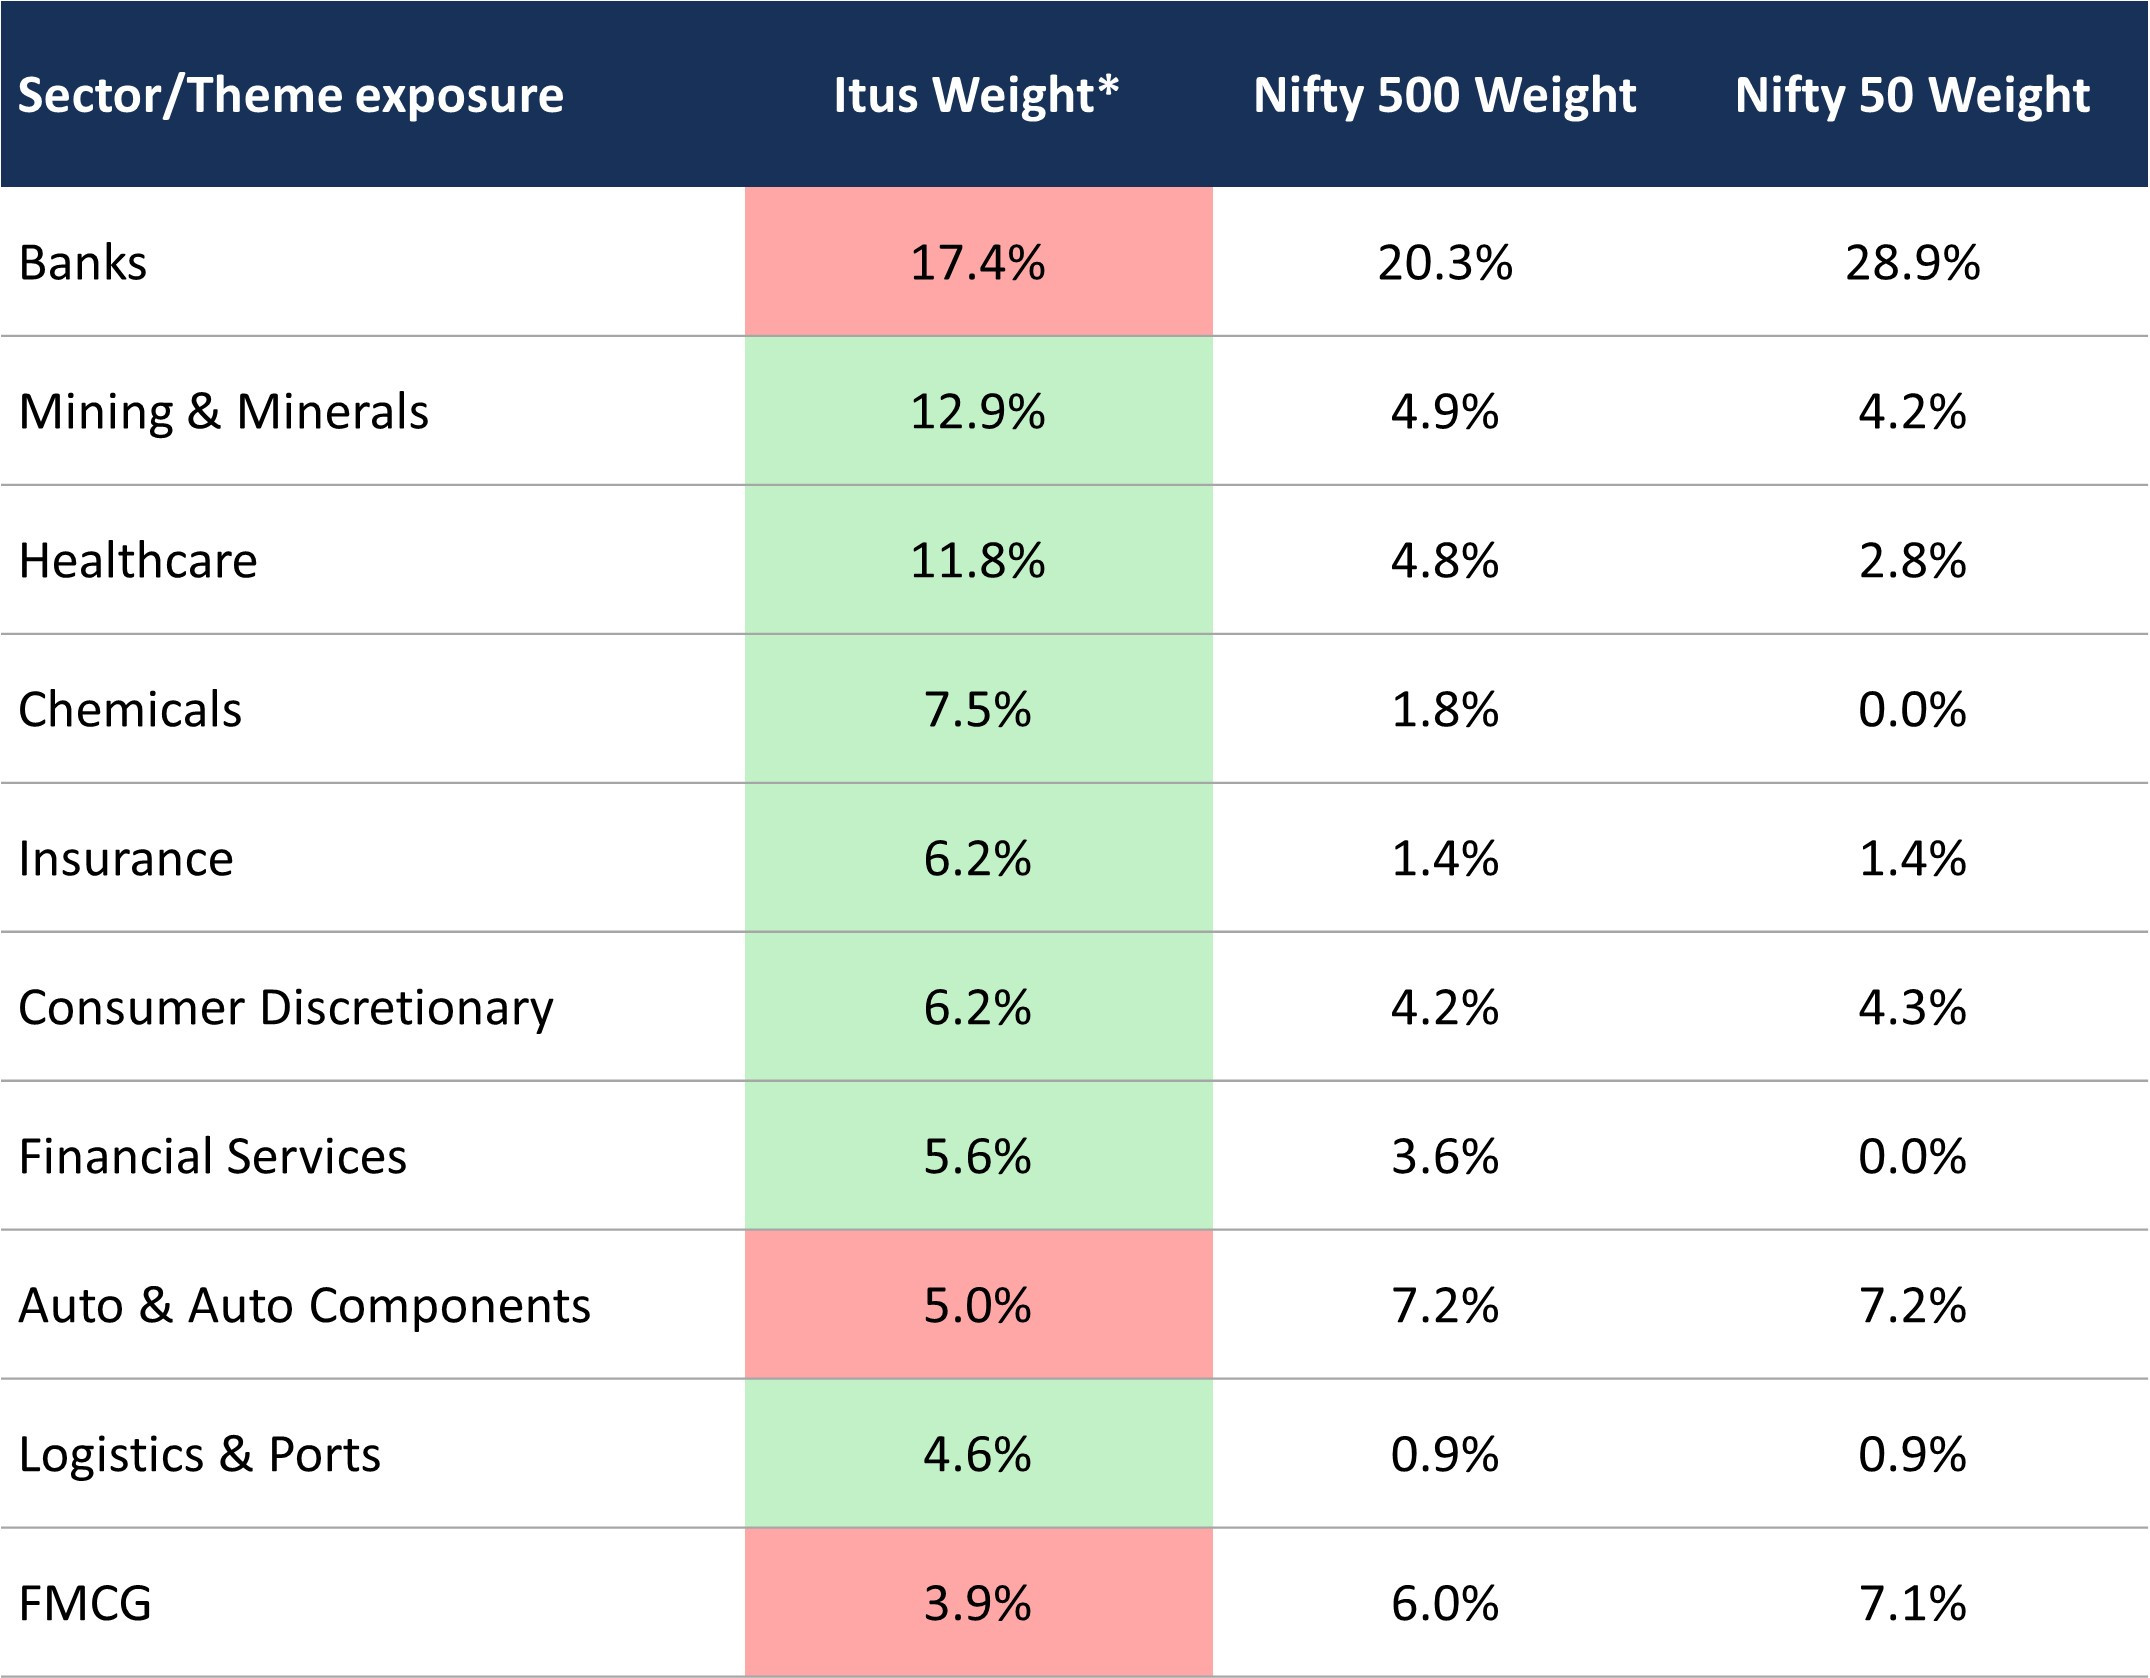
* Green shading indicates overweight positions; Red shading indicates underweight positions relative to benchmarks
Exhibit 2: Top 10 sectors for Itus by weight against benchmarks
While our overweight exposure to Mining contributed positively to performance during the quarter, supported by favourable commodity price movements, we recently reduced our exposure from a risk management perspective. Given the inherently cyclical nature of commodity-linked earnings, periods of price stability often coincide with peak operating leverage — warranting a reassessment of position sizing even as near-term earnings remain supportive.
Divergence in Consumption Trends:
Demand conditions across consumption-linked sectors continue to remain uneven, with a clear divergence emerging between premium discretionary and mass-market segments.
High-ticket discretionary categories such as travel, hospitality, and jewellery have demonstrated resilience through the quarter. Industry-wide hotel average daily rates (ADRs) rose ~14% YoY to ₹10,300 in 3QFY26, with occupancy levels improving to ~73%. Similarly, air travel demand has remained robust, with Indigo sustaining a volume CAGR of ~11% over FY2024–26 alongside consistently high load factors of ~85%. Passenger vehicle volumes also recovered during the quarter following multiple periods of muted growth.
In contrast, demand across everyday discretionary categories continues to exhibit signs of softness. Same-store sales growth for value-oriented retailers such as VMART, DMART, and Trent has moderated to low single digits over recent quarters, suggesting continued pressure on volume-led consumption.
Organized jewellery retail remains a notable exception, with players such as Titan and Kalyan maintaining resilient same-store sales performance, aided in part by gold price movements and premium consumption trends.
Taken together, these trends indicate a continuation of a bifurcated consumption environment, where premium and aspirational spending remains relatively stable, while mass discretionary demand continues to lag.
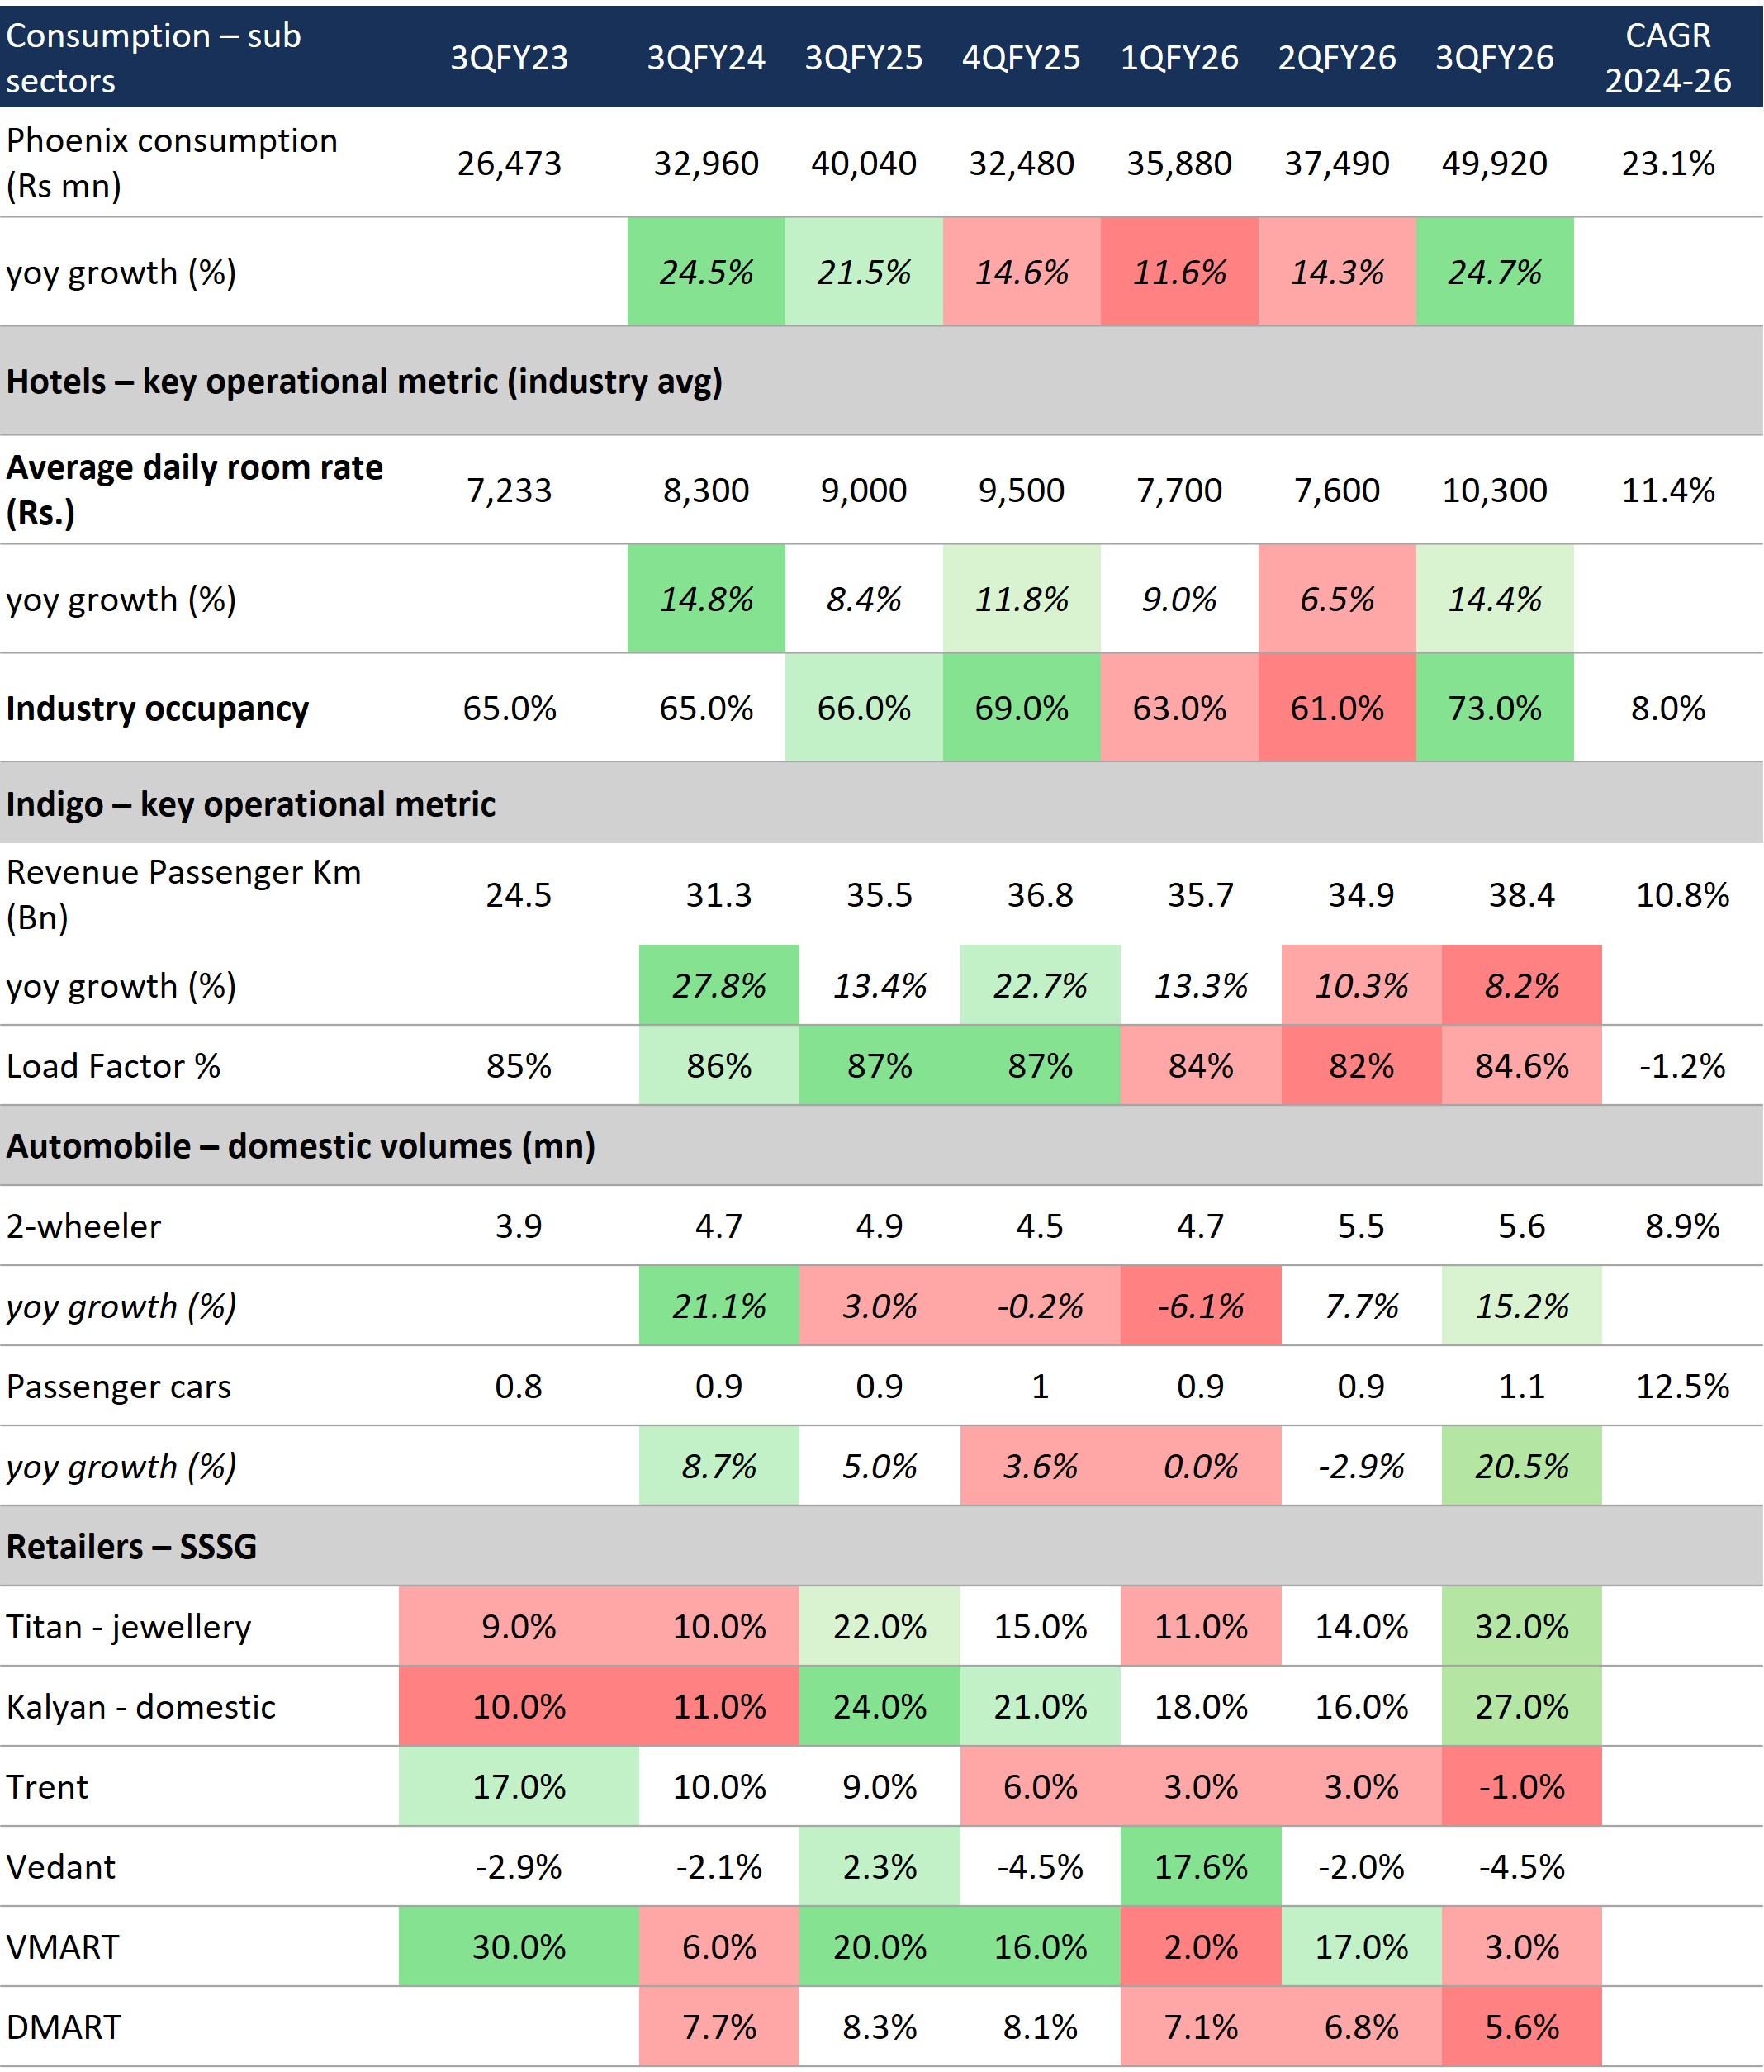
* Trent in recent quarters has given qualitative range for SSSG. The above is based on that commentary
Exhibit 3: Consumption growth trends across sub-sectors
In the absence of a broad-based recovery in consumption, earnings growth is likely to remain concentrated in businesses with pricing power and exposure to premium discretionary demand — reinforcing our preference for companies with stronger margin resilience over volume-led growth. In parallel, funding conditions across the banking system continue to shape the transmission of credit into real economic activity.
Credit Conditions and Deposit Dynamics:
System-level credit growth accelerated to ~14% YoY during 3QFY26, following a period of relatively moderate growth in prior quarters. The pickup was led by MSME and corporate lending, while retail credit growth was supported by a recovery in vehicle loans and continued strength in gold loans.
Deposit growth also improved during the quarter to ~13% YoY; however, it continued to lag credit expansion. As a result, the system credit-to-deposit (CD) ratio remained elevated at ~81%, indicating sustained competition for deposits across the banking system.
In such an environment, the ability to consistently mobilize low-cost retail deposits becomes increasingly important in protecting funding costs and preserving margins. Banks with weaker deposit franchises or higher reliance on bulk funding may face challenges in sustaining net interest margins as competition for deposits intensifies.
Conversely, institutions with stable retail deposit bases and the ability to deploy incremental credit into higher-yielding loan segments are better positioned to grow without materially compromising profitability.
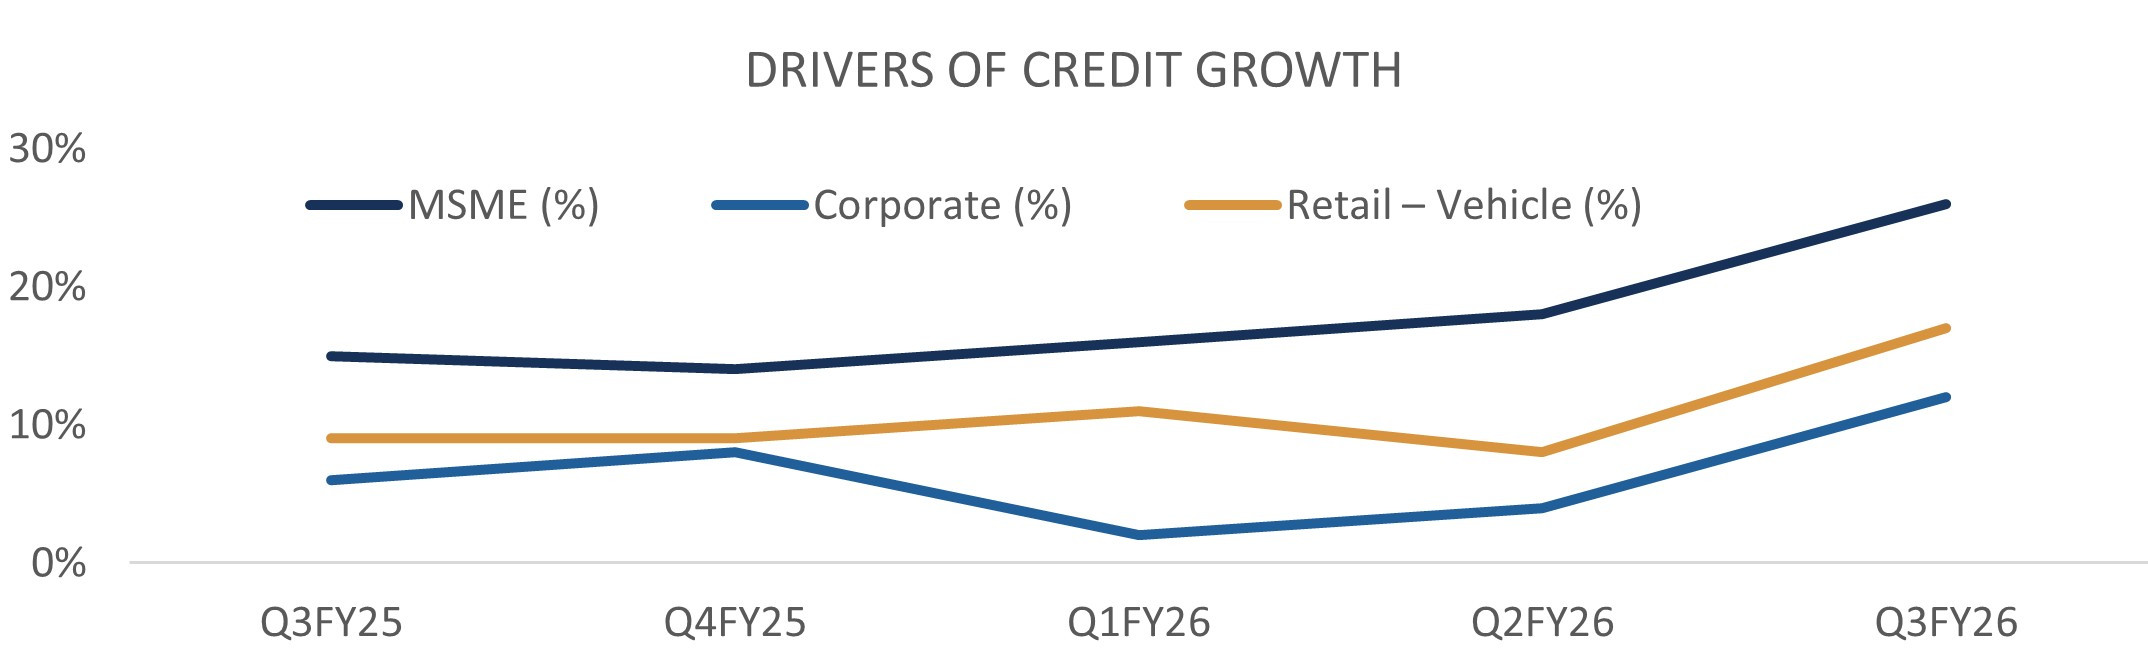
Exhibit 4: Drivers of credit growth (5Q)
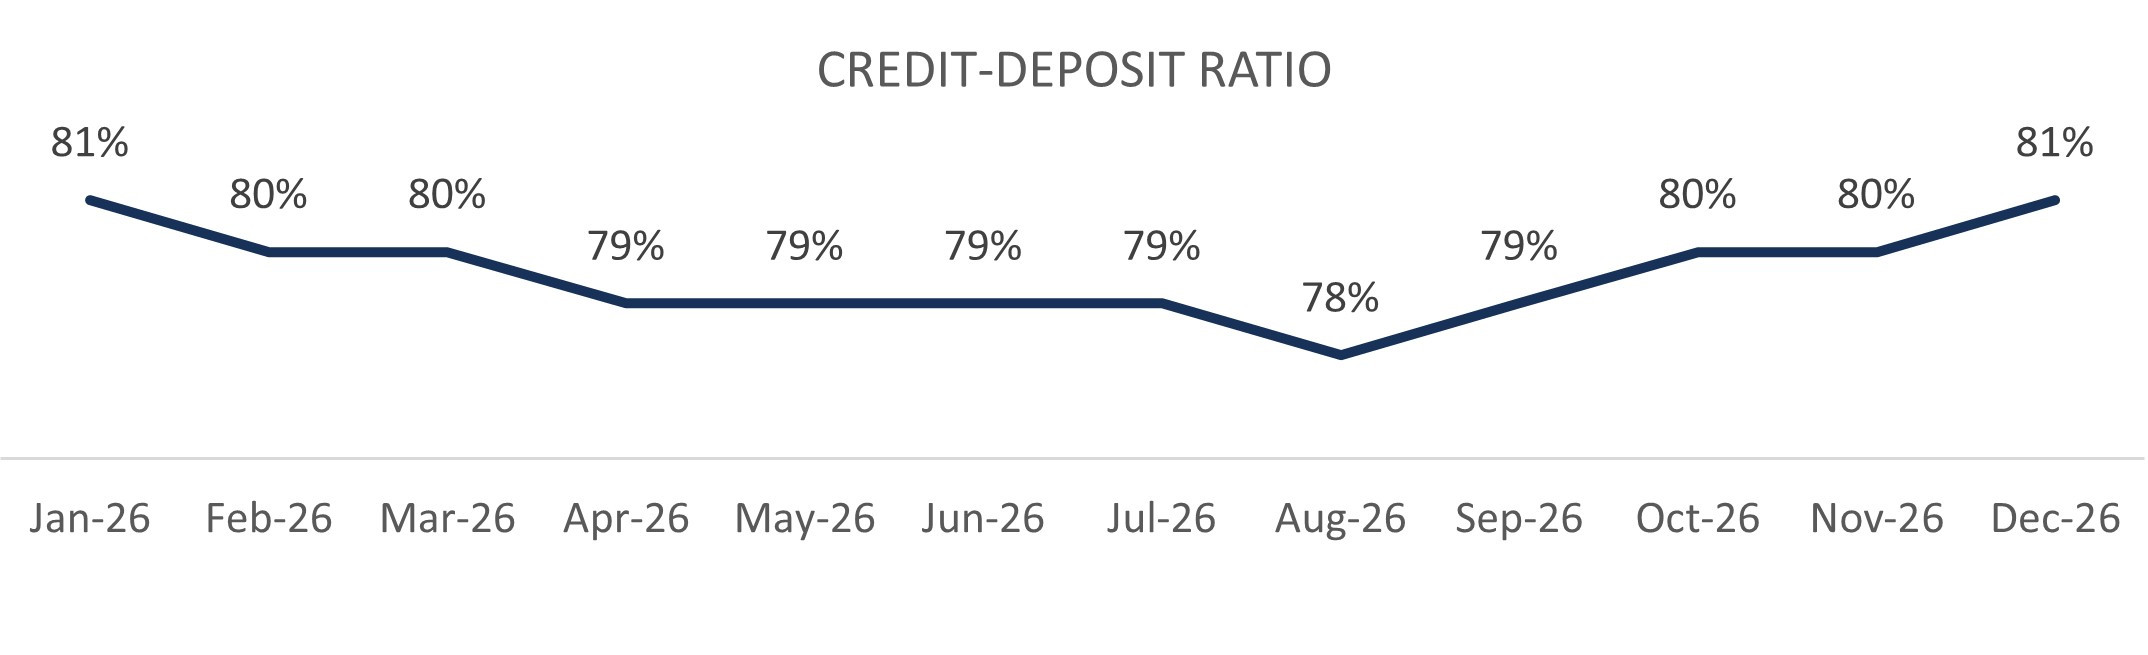
Exhibit 5: Credit-Deposit Ratio (12M)
Portfolio Illustration: City Union Bank
One such example from our portfolio is City Union Bank, which reported ~21% YoY growth in both credit and deposits during the quarter, alongside a 31bps expansion in NIM to ~3.9% in Q3FY26. The bankʼs credit growth strategy is supported by its focus on MSME, gold loans, and secured retail segments.
Alongside demand and funding conditions, supply-side developments across export-oriented sectors such as chemicals remain an important monitorable.
Chemicals: Gradual Recovery
We highlighted an early pickup in revenues and margins within the chemical sector in our previous communications. This trend has broadly continued into Q3FY26, with Nifty 500 chemical companies reporting revenue growth of ~10% YoY and EBITDA margins holding at ~19%.
However, recovery within the sector remains selective rather than broad- based. Pricing pressures and competitive intensity from Chinese manufacturers continue to persist across several product categories. Despite this, certain companies have been able to demonstrate earnings resilience through a combination of product mix improvements, capacity investments undertaken during the downcycle, and increasing participation in specialty and contract manufacturing segments.
Key drivers supporting earnings improvement for select players include:
These factors have enabled certain businesses to sustain revenue growth and protect margins despite ongoing pricing pressure across commodity-linked segments.
Portfolio Illustration: Navin Fluorine
One such example within our portfolio is Navin Fluorine, which operates across refrigerants, specialty chemicals, and CDMO segments within the fluorochemical value chain. During the quarter, performance was supported by specialty chemical exports, while tailwinds within the refrigerants segment remain linked to supply-side rationalisation in China.
Looking ahead, a key monitorable for the sector is China’s proposed ‘Anti- Involution’ policy, under which export rebates across several chemical categories are expected to be removed effective April 2026. This policy action is aimed at rationalising overcapacity and improving domestic margins, which may in turn increase procurement costs for international buyers and potentially create opportunities for Indian exporters over the medium term.
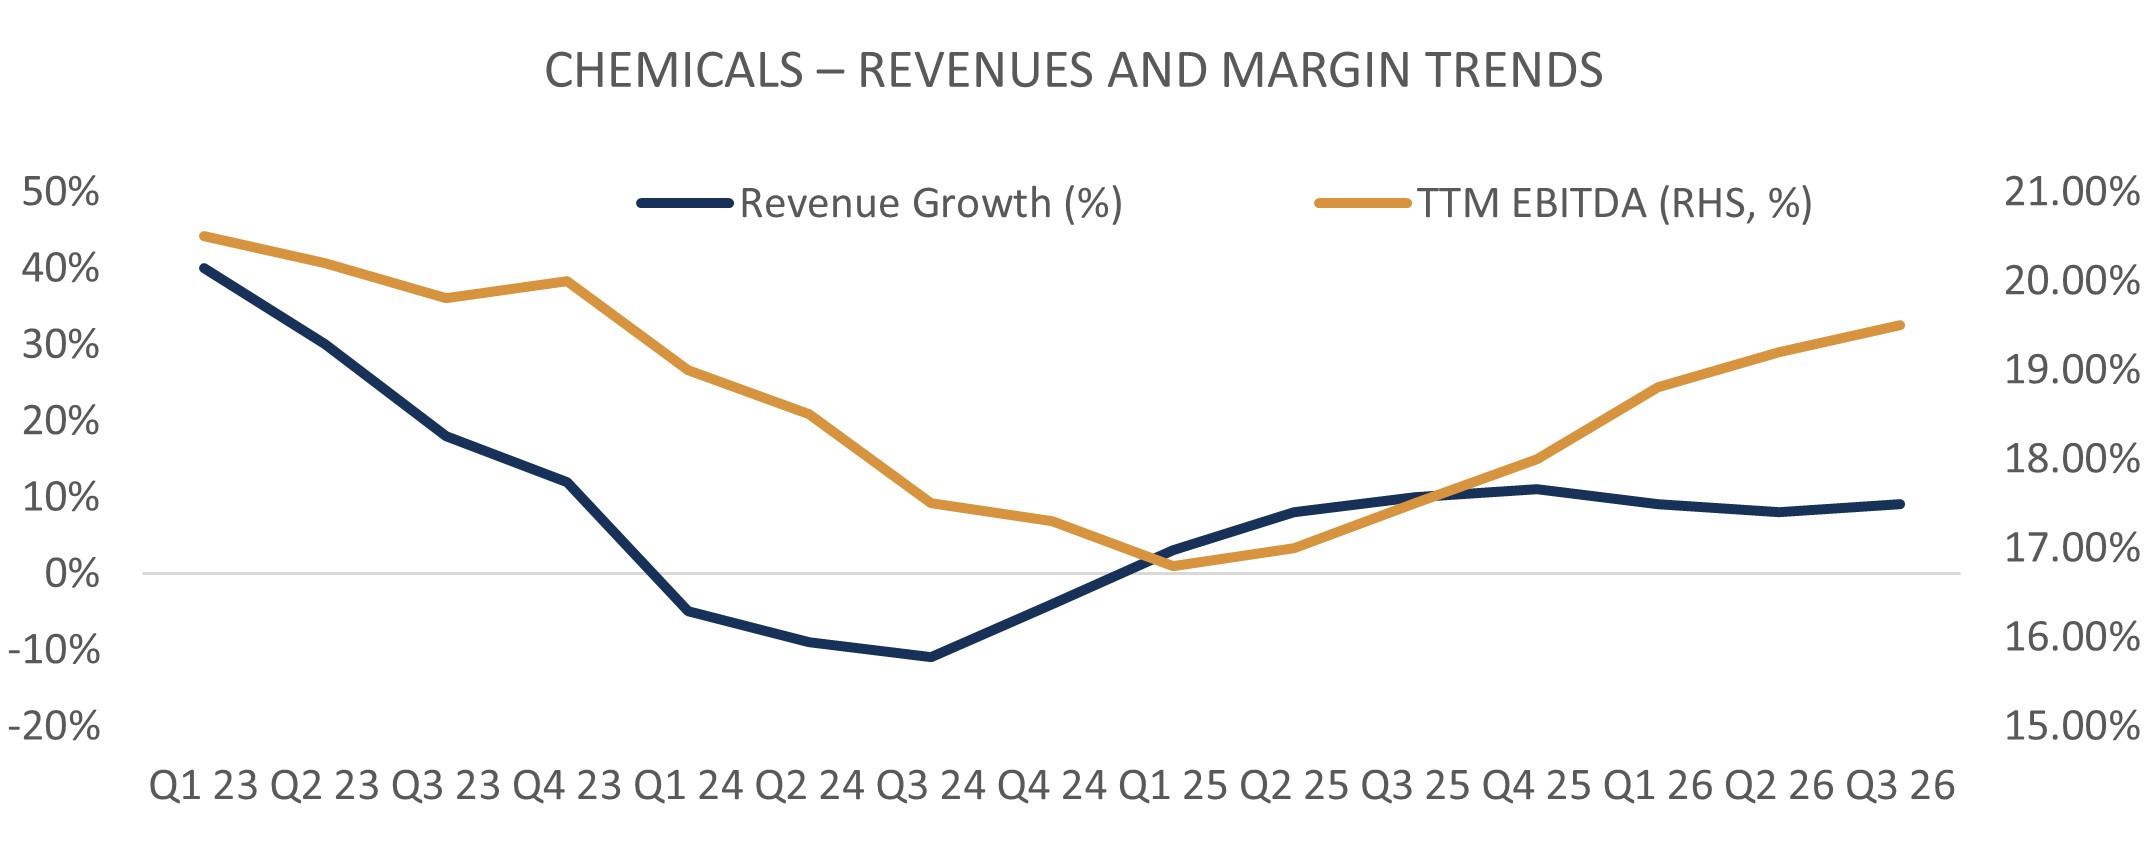
Exhibit 6: YoY revenue growth & EBITA margin of Nifty 500 chemical companies
Portfolio Implications and Watchpoints:
Earnings delivery during the quarter continues to reflect a broader pattern of concentration, with growth remaining skewed towards businesses benefiting from pricing power, operating leverage, or exposure to premium discretionary demand.
Key positioning takeaways:
Key watchpoints:
Portfolio Summary:
Our stock selection and sector positioning reflects this dynamic. To summarise, the below table gives an overview of the health of our portfolio as of Q3FY26 (with the snapshot as of January 2026).
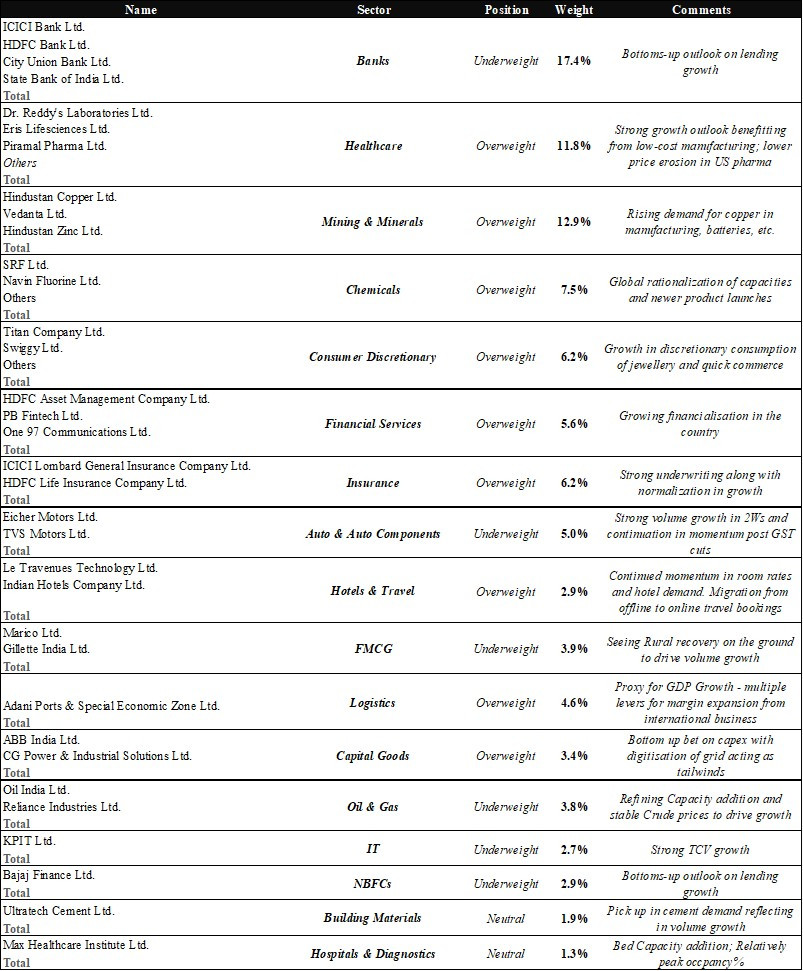
Note: The sum of above weights would not total up to 100%; remaining would be our cash holdings.
Team Itus
Indian markets consolidated as oil stabilised following an Iran-US agreement and global flows stayed anchored in US chip…
June 2026
Our portfolio companies reported revenue growth of ~24% YoY during the quarter, a further step-up from the ~20%…
June 2026The Iran-Israel escalation from late February pushed crude above USD 100 a barrel for the first time since…
March 2026