The human mind loves stories – especially around stories of the market. 2020 was a year, where we saw it all, a pandemic that made the world come to a standstill and we are ending the year, where many pundits are now calling a bubble that is ready to pop and cause a crash in the markets anytime.
What this at Itus made us go back to is to understand the dynamics of a bubble. To do this, we went back to one of the benchmark names in most tech portfolios in the US today, Amazon, and how Amazon performed during the last 1999-2000 bubble that we experienced in the US.
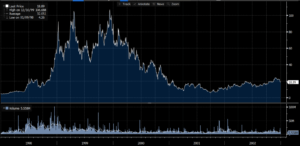
The below chart gives the 4Yr price move of Amazon during the period (between 1998-02)

While Amazon IPOed in May 1997 at $18 (Split adjusted, this would be $1.5 in today’s stock price) at a market cap of USD 440mm. In fact, the stock fell post the IPO, unlike the IPOs we are in the middle of in 2020. The storyline behind Amazon was a lot muted, the company was an online retailer of books, and if you remove the word Amazon from the company (to remove the association with the ‘verb’ it has become), the business sounds fairly ‘unsexy’. The business had revenues of USD 35mm during the IPO but was growing 100% qoq.
Towards the end of 99, the company Amazon was valued at USD 35bn with a revenue of USD 1.1bn (so while richly valued, the growth the market expected was ~60% yoy). At the same time, towards the end of 99, the margin dropped from 50% to 40% (which was a 20% drop)
When the market cracked starting March 2000, the market cap of Amazon fell to USD 2bn and during the next 2 years over this period saw revenue growth of 13% yoy over this period alongside net margin improvement.
During the 5 years post IPO, investors who were ‘long-term’, saw their investment go up 90x over 2 years and then saw a 90% drop in value from the peak over the next 3 years. Put another way, the company saw a valuation change of 31x Sales to 0.5x at the lows – This at its very essence is why Investing will continue to remain hard and the markets will test long-term investors at their core.
Disclaimer:
The performance-related information provided in this newsletter/blog is not verified by SEBI. The content is intended solely for internal circulation and general informational purposes. It does not constitute investment advice or any form of financial recommendation.
The research information shared herein may contain inaccuracies or typographical errors. All liability for actions taken or not taken based on the content of this newsletter/blog is expressly disclaimed.
No reader, user, or browser of this Newsletter / blog should act or refrain from acting based on any information in this newsletter/blog without seeking independent financial advice. Use of, and access to, this publication or any links or resources provided within do not establish a portfolio manager-client relationship between the reader, user, or browser and the authors, contributors or Itus Capital.