

The AI Boom Is Changing Hands
The AI Boom Is Changing Hands For much of the last three years, the AI story looked deceptively…
July 2026
The financialization of the Indian capital markets has been a significant theme that has gained traction over the last decade. This has significant implications and investment opportunities across asset management, exchanges, brokerages, insurance, and market infrastructure companies. However, it’s important to understand the nature of this growth, where it has come from and the cyclicality, if any, across segments.
The capital markets in India today have often been compared to the US 25 years back, in terms of the growth of the capital markets and the penetration of financial assets and the participation in the country. The last decade (2010-2022) has given us a glimpse of the growth that India as a market has giving a framework for growth for the next 10 years. However, the Indian market and the consumer has always been and will continue to be very unique in their expectations, taste and preference and the same comes through in the capital markets too. The next few charts give a glimpse into this growth:
Fig 1 : Current capital markets valuation in India vs rest of the markets
Note : We are at the median of our range over the last 20 years vs the US which is a 2std dev above mean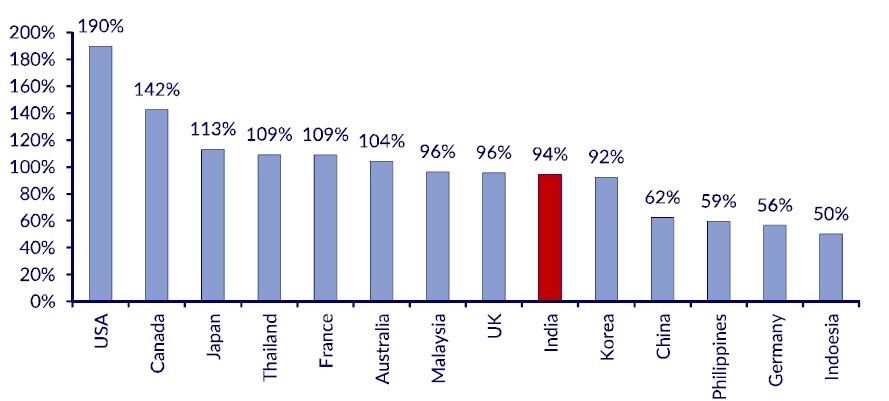
Source : Bloomberg
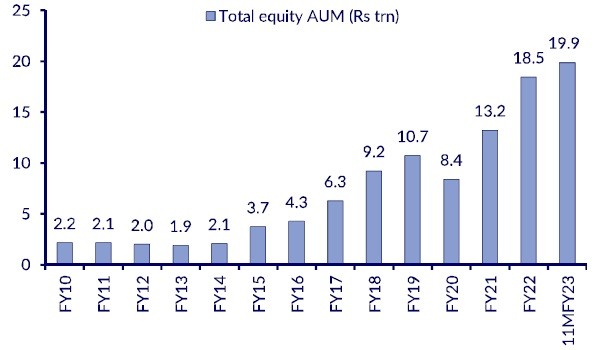
Fig 2 : Equity AUM managed by funds crossed USD 200bn in FY22
Note : The CAGR of the AUM was at 15% between 2010 and 2020. The last 3Y has seen a CAGR of 25%
Source : AMFI
The EPFO ETF AUM (which started in 2016) has grown from 0 to USD 30bn to now. This contributes to 14% of the overall AUM as we stand.
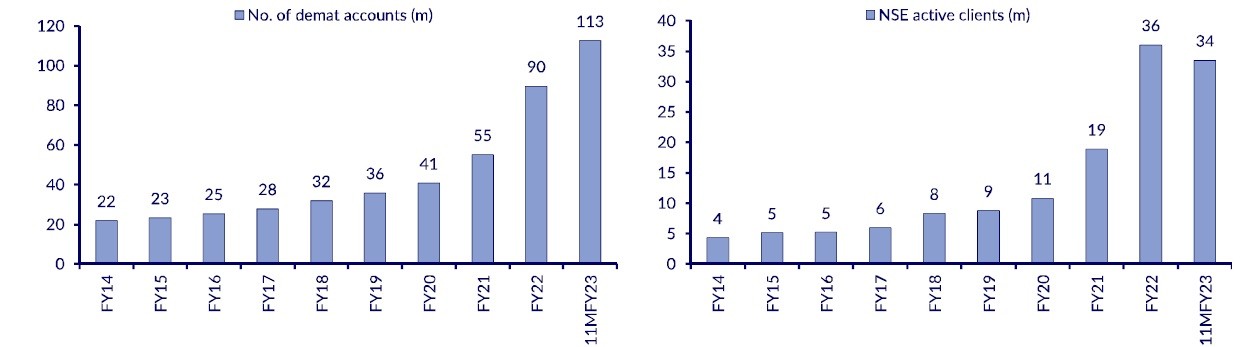
Fig 3 : No. of demat accounts has grown 5x since 2014 Fig 4: No. of active NSE clients have grown 9x over the same period
Source : NSE, BSE, CDSL, NSDL, CLSA research
Note : It’s interesting to see the number of active clients grow multi-fold the number of demat accounts
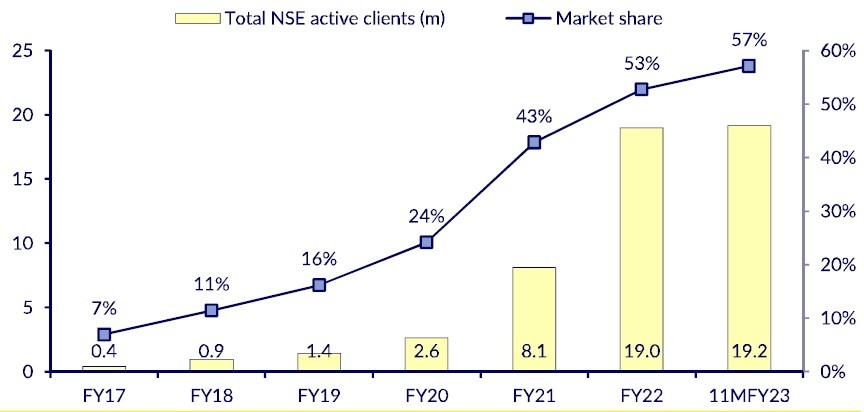
Fig 5 : It’s interesting to see the NSE active client pickup has a trend with the increase in discount brokers taking market share (11% to 57% in the last 5 years)
Source : NSE, CLSA research
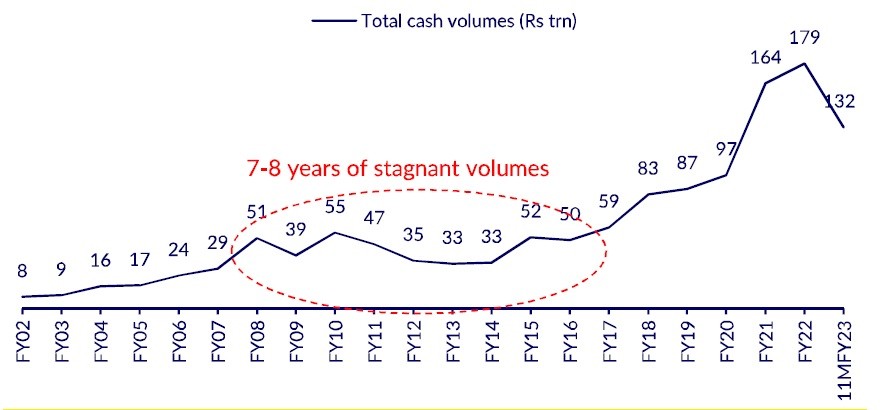
Fig 6 : Growth of Cash volumes on the exchange
Source : NSE, BSE
Note : It’s important to note that cash volumes on the exchange are not structural. We have seen multi-year stagnant volumes. While the long term trend is growing at 18% CAGR, that’s on the back of growth over the last 5 years
Fig 7 : growth of F&O volume on the exchange
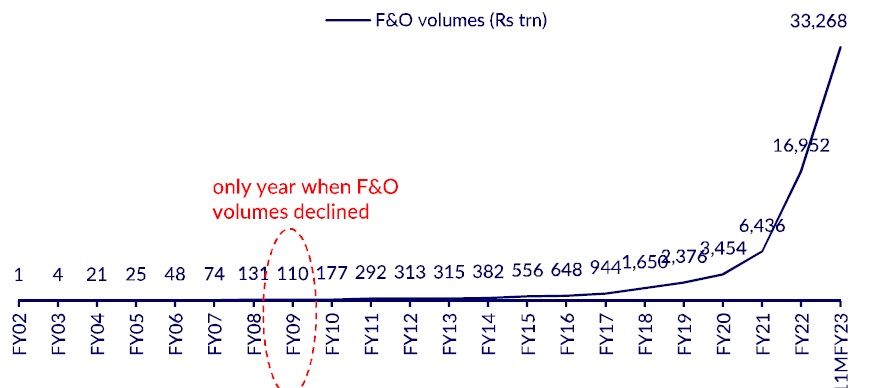
Note : While cash volumes have been cyclical, F&O volume in India has gone through the roof. Over the last 20 years, apart from 1Y we have never seen a decline. This is one of the trends that discount brokers capitalized on significantly.
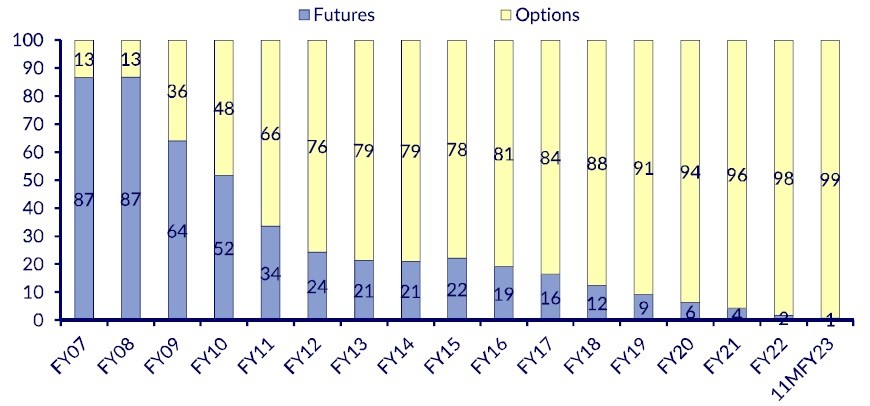
Fig 8 : F&O volume is dominated by options today
Source : NSE, CLSA
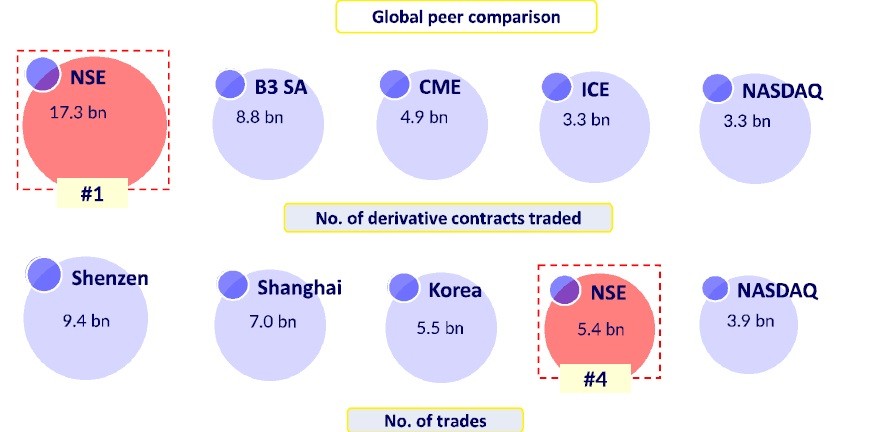
Fig 9 : We are a structural market for derivates and the worlds larges by volume. In cash, we are #4
Broad Takeaways for the reader:
The AI Boom Is Changing Hands For much of the last three years, the AI story looked deceptively…
July 2026
From changing market structures to shifting capital cycles, here are a few signals that stood out: • There…
July 2026An ant colony has no CEO. No fund manager. No investment committee. No individual ant understands the colony’s…
July 2026