Reviewing Q2 FY23 at Itus (September 22 Numbers)
The quarter went by saw strong annual growth in revenue and profitability across our portfolio. There were a few interesting trends in our portfolio companies which we highlight in further detail below:

Note: For the year-on-year (YoY) measurements, we have taken a rolling 4 quarter format, i.e., Q2FY22 to Q2FY23, as compared to Q2FY21 to Q2FY22. This helps us track growth of our portfolio better, without overt dependence on cyclicality in the quarter.
We also measure the health of the portfolio with the following metrics, which give us a summary of the earning capability of our holdings.

In our communication this quarter, we find it imperative to highlight a few themes that have a material impact on risk.
Consumer Discretionary:
As the Indian Economy continues to grow, discretionary spends by consumers will increase disproportionately. Looking at World Bank data and Ministry of Statistics (MOSPI) India data, discretionary spends contribute approximately 30% of GDP per capita (~$2,300) today. This spend is projected to contribute 40% by 2025 on a per capita basis, which assuming a ~7% growth rate on the GDP annually, would see an increase of ~74% in discretionary spending by 2026.
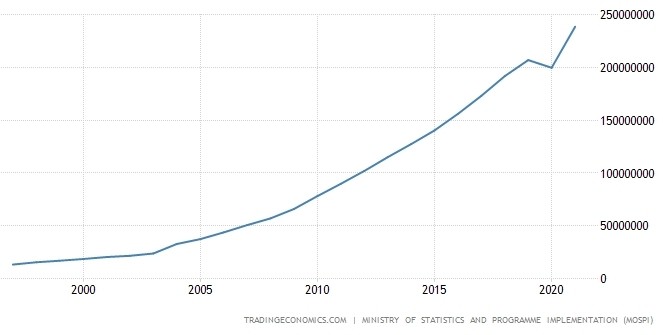
Fig 1: Disposable personal income of India over the last 25 years
With rise in disposable income, increased consumer spending, propensity to spend on discretionary retail (non-necessities like eating out, fashion, premium products etc.) increases. As India turns to its next phase of growth, consumer is a theme to watch closely. Companies that are able to grow / maintain gross margins while taking advantage of these macro trends will be large beneficiaries.
Globally, the macroeconomic outlook is challenged by a combination of factors such as persistent inflation, energy price shock, increasing recession fears and geopolitical conflicts. Most of these uncertainties dominate the short-term outlook. However, in 2022, Indian discretionary consumption looks better than ever, with no signs of slowing. Within the segment, companies that evidence their pricing power and control over their costs will see long-term tailwinds from increasing discretionary spends flowing through to cash flows.
To highlight the increase in discretionary spending, Shishir Srivastava (MD, Phoenix Mills) spoke about the trend, despite footfalls at 90% of its pre-pandemic peak:
“Consumption in Q2 FY23 stood at Rs. 2,199 crores, … the growth was at 18%. Led by the festive season and new brand launches, this was the highest quarterly consumption done at our malls in the second quarter of any financial year. Consumption was robust across categories in the second quarter. Some of the top performing categories were jewellery where consumption was up 132% from Q2 FY20. Electronics, which was up 35% from Q2 FY20; fashion and accessories up 33%; food and beverages up 33% and multiplex up 15% from Q2 FY20.”
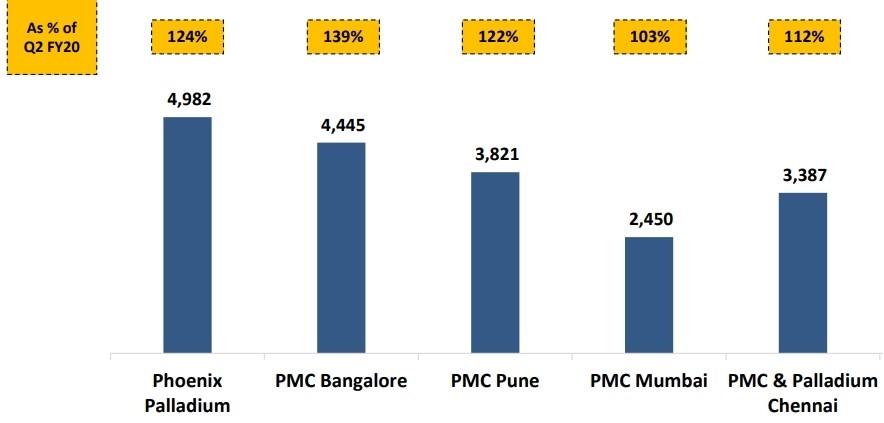
Fig 2: Mall consumption increased across all major metro cities (Pheonix Mills)
We want to highlight a few beneficiaries of increased consumer discretionary spends:

Fig 3: Per Capita footwear consumption in India vs. the World
Hospitals (NFAT + Capital Expenditure update):
Hospitals, in general, are a very-high fixed cost business, with building and construction costs, expensive medical equipment and surgical devices. Essentially, having low variable costs mean that these businesses will see significant operating leverage they during a period of recovery and revenue expansion as capital expenditure on facilities mature.
Over the past few quarters, hospitals have announced investments in capital projects in an effort to expand their bed counts and geographic reach. During the pandemic, several hospital chains have largely de-levered their debt, concentrating on cost-cutting and subsequently raising EBITDA margins. (Max Healthcare’s EBITDA margin went from 12.8% in FY20 to 26.4% in FY22). Today, we are seeing an increase in Capex from hospital chains coming through in a large way. To highlight a few – Narayana Hryudalaya has invested 1000cr Capex in FY23E and will additionally invest another 1,000cr in FY24E with a focus on cardiology and oncology. Currently, the company has 6145 operational beds with an aim to add ~800-1000 more in the next 2 years.
To illustrate through another example, Max Healthcare aims to double its bed count in next 6 years, currently operating ~4,200 beds. Capex announced for FY23 is 670cr. The bed counts will be largely through brownfield and greenfield expansions, through a lease-and-operate model.
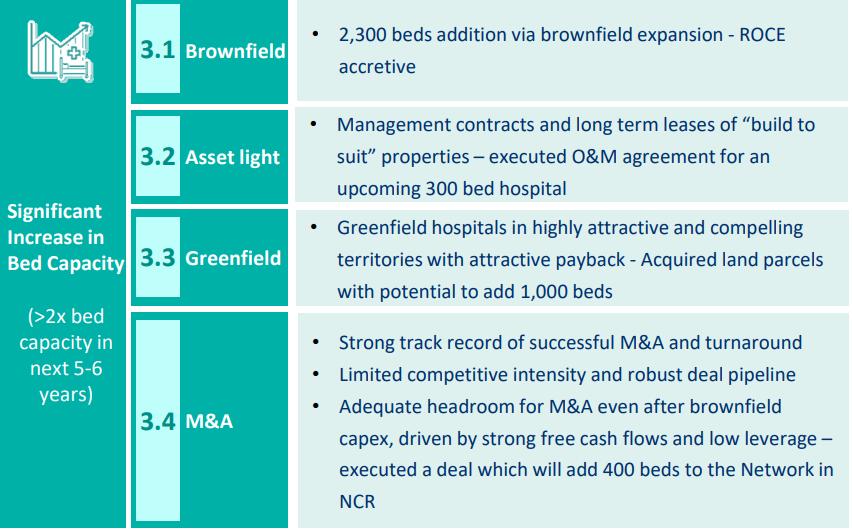
Fig 4: Excerpt from Max Healthcare’s Q2FY23 investor presentation
Hospitals measure a few key metrics that help us measure their growth and health:
Coming out of the Covid-19 pandemic, single / focused-multi specialty hospitals have been key beneficiaries of normalizing occupancy rates – as diagnostic testing for chronic and general illnesses increased back to pre-pandemic levels.
The following is an excerpt of Dr. Ramesh (MD, Rainbow Children’s Medicare) during their Q4FY22 concall highlighting how reaching maturity helps their profitability.
“In terms of utilization, we as a children’s hospital and perinatal services, … our occupancies about in a steady state in the normal year was about 56% in 2020. We expect to go, cross over 50% this year in a blended occupancy. … so, in a mature state like in Hyderabad where we can we reach up to 70%-72% of occupancies. So, when we do about 55% of occupancy, we do extremely very high revenue as well as profitability. That’s how trajectory we are looking at it.”
As a hospital’s new beds Capex materializes and gets to a stage of maturity, their increased occupancy would result in higher Fixed Asset Turnover, allowing for faster breakeven on Capex.
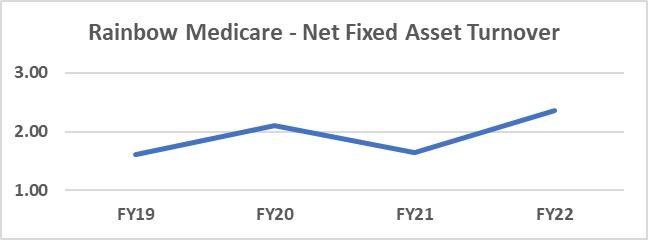
Fig 5: Net Fixed Asset Turnover for Rainbow Children’s Medicare
A higher/increasing Net Fixed Assets Turnover for any business that runs on fixed assets is a tell-tale sign of monetization efficiency on the topline. When paired with operating leverage that a hospital would gain, This would in turn flow though to the bottom line.
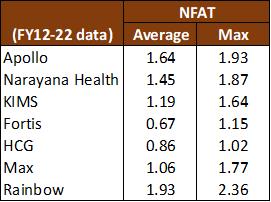
Fig 6: Net Fixed Asset Turnover for top Hospital Chains (listed)
A key dynamic that results in a varied NFAT for hospitals are the Capex cost per bed. A typical multi-specialty hospital runs at a Capex cost of ~1.2 crores per bed in a leased model, and ~2cr per bed in a fully owned model. In a focused specialty, the Capex costs per bed is lower given the limited requirements of equipment. Key standouts are Apollo Hospitals and Rainbow Medical, who are able to manage a higher revenue per bed (ARPOB) while maintaining the dynamic of lower Capex costs, resulting in higher efficiency and increasing margins.
Diagnostics:
As per industry reports, Indian diagnostic market is USD12bn in size. However, almost 70%-80% of the market is still unorganized and large organized chains account for a minuscule 15%-19% of the market. The diagnostics industry is emerging from the benefits of increased Covid testing volumes and is now facing intensifying competition from varied types of players. The competitive intensity has increased post covid and there is an increased focus by these players on preventive/wellness package and increased home sample collection. The stock price correction from the Covid highs of these diagnostics businesses was largely driven by normalization of multiples. However, the market and the analysts’ concern revolve around the e-commerce and digital players cutting price to gain market share thus causing a deterioration of the industry margins.
When we look at H1FY23 numbers of the top players in the diagnostic segment, we see that their non-Covid revenues have in fact grown 20% YoY. While there are concerns regarding competitive intensity in the space, where the new entrants are offering steep discounts, we must understand that discounts are more of a brand-building exercise. In addition, it will be an uphill task for new players to build the country-wide testing infrastructure and relationships with doctors that the incumbents have established over the years. Also, hardly about 30% people actually come more than once in a year, so we believe that quality matters much more than price in this segment, which provides companies DLPL edge over the new-comers. We believe The new-age PE-backed players could act as catalysts to shift from unorganised to organised, rather than eat the pie away from the players at top given the large unorganized segment.

Table: Covid and Non-Covid revenues of DrLalPath Labs and Metropolis over last 8 Quarters
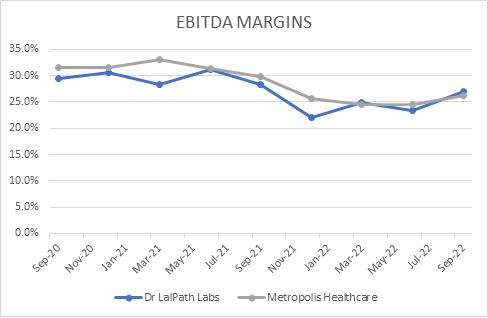
Fig 7: EBITDA Margins of Dr.LalPath Labs and Metropolis Healthcare
However, as the covid volumes and higher margin allied tests are seeing a slowdown, the EBITDA margins of these companies have returned near their pre-covid levels. However, due to higher investments in customer acquisition, network expansion, upgrade of IT infrastructure and digitalization initiatives, and possibly higher fees to collection centres going ahead there is possibility of diagnostics companies facing pressure on their margin profile in the short-term.
While the narrative in the market may continue to show in the form of margin drop over the next few quarters, we believe that the valuation de-rating prices this risk well today.
Investment Changes
This past quarter we made a few changes to our investments. We shall highlight our reasoning and thesis for our decisions.
Jubilant Foodworks (Buy):
Jubilant Foodworks owns and operates franchisee restaurants of Domino’s in India, Bangladesh and Sri Lanka. The company additionally also has Dunkin Donuts and Popeye’s stores, as well as some own-brand restaurants.
Of the total food service industry market size in India of 4.3 lakh crores in FY20 (pre-covid data) of which Chain QSR restaurants contribute 4% (or 18,800 crores). Dominos contributes ~21% of the chain QSR market in revenues and ~18% in store count (~1,700 stores today). Domino’s has consistently been the best in QSR category metrics for ROCE (23%), penetration (310 Cities), Gross Margins also high at 76%. The company looks to grow through expansion in semi-urban geographies, plus split stores in major metro cities. (With a target to get delivery time down). Growth targeted by Jubilant’s management for store expansion is 350-400 stores in next 2-3 years. To highlight the scope of achievable scale, food delivery aggregator, Swiggy has a penetration of 550 towns and cities in India, with over 200 of them where Domino’s currently has no presence.
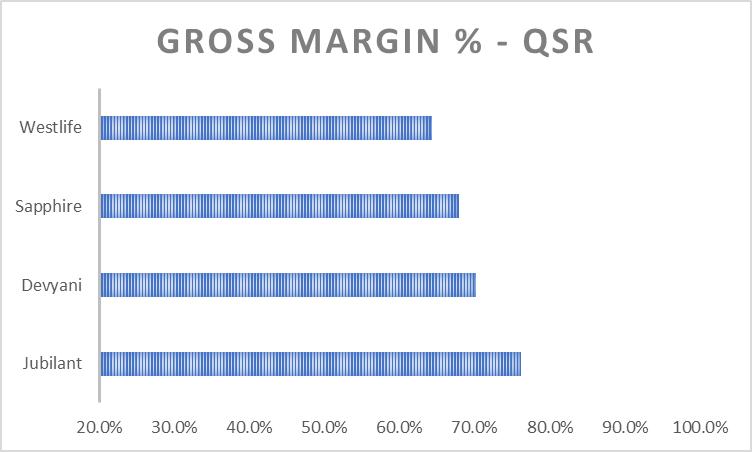
Fig 8: Gross Margin comparison of QSR companies.
Jubilant’s handling of their own last mile logistics (while using food aggregators for discovery) has been a beneficial strategy, having significantly higher delivery volumes than from Pizza Hut and other Pizza chain restaurants. (Domino’s average sales/store per day is 85k, Pizza Hut is 60k).
With the growth in store count going live and store sales increases, I anticipate that Jubilant should generate 6,500cr in topline by FY24E, and an FCF growth at ~24%. We believe that considering the moats and best-in-class operating ratios, the company deserves a position in our portfolio.
Rainbow Children’s Medicare (Buy):
Rainbow Hospitals is a chain of paediatric hospitals headquartered in Hyderabad, India. The Rainbow Hospital Group currently operates out of 12 locations – 6 in Hyderabad, 1 in Vijayawada and Vizag each (total 2 in AP), 2 in Bengaluru, 1 unit each in Delhi and Chennai.
Coming out of Covid-19, single / focused-multi specialty hospitals have been key beneficiaries of normalizing occupancy rates – as diagnostic testing for chronic and general illnesses increased back to pre-covid levels. We believe this to be the biggest driver of the business today, leading to operational leverage. Additionally, as a hospital’s new beds Capex materializes and gets to a stage of maturity, their increased occupancy would result in higher Fixed Asset Turnover, allowing for faster breakeven on Capex.
Hospitals, in general, are a very high fixed-cost business. Essentially, Rainbow Children’s Medicare would see a significant operating leverage they during a period of recovery (coming out of Covid-19 pandemic, where utilization of single-specialty and focused multi-specialty hospitals were sub-optimal) and revenue expansion as new hospitals attain maturity. As of FY22, the company operates a maximum of 1,500 beds. The company plans on adding approximately 600 beds over the next 2 years. (Adding 300 beds in Hyderabad, 2 spokes in Bangalore and 1 spoke in Chennai)
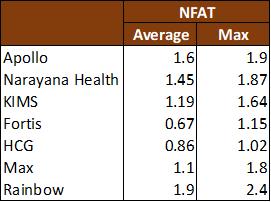
Fig 9: Net Fixed Asset Turnover for top Hospital Chains (listed)
Despite running at a beds utilization of only at 56% (pre-pandemic), the NFAT of Rainbow consistently higher than most multi-specialty hospitals in India. This is because a typical multi-specialty hospital runs at a Capex cost of 1 to 1.2cr per bed in a leased model, and ~2cr per bed in a fully owned model (greenfield, where they construct). The advantage that Rainbow holds is because it is a paediatric setup, they run at a 50L per bed Capex cost which comes due to lower cost of equipment vs a multi-specialty hospital.
Given that the management have guided for aggressive growth and recovery from pandemic lows in occupancy to further drive operating leverage, we expect Rainbow to generate a topline of ~1,700cr and a PAT of ~240cr by FY24E.
RHI Magnesita (Buy):
RHI Magnesita is engaged in manufacturing and trading refractory products. Refractories are a perfect proxy to steel demand (70% of the demand for refractory products comes from the steel industry). But despite the dependency, refractory companies don’t show qualities of a commodity company as their gross margins do not get affected as they are able to pass on the fluctuation of raw material cost, which represents the characteristic of consumables and pricing power for such a sector.
We expect the company to nearly double its topline and volumes by FY25 compared to FY22. This will be possible due to its comprehensive product portfolio and capacity expansions across all products. Coupled with the macro tailwinds, we believe the plans to expand the capacities in Cuttack plant for recycling of magnesia bricks will result in substantial cost savings and import substitution of demand from Chinese player.
We see the company using India as the low-cost manufacturing hub and using it as the export base to the world (West Asia, South Asia and Africa markets) with a goal to centralize supply chain and product development (new R&D centre at Bhiwandi). Thus, a strong commitment from the parent company (plans to invest 450crs over the next 3 years for capacity expansion and potential acquisition) implies strong demand from steel manufacturers and a focus to capitlizse on more localization.
Metro Brands (Buy):
Metro Brands is a one-stop-shop footwear specialty retailer catering to all the footwear needs of men, women and children for both casual and formal occasions. Metro also has wide presence across price points (economy, mid and premium segments). It has been able to achieve such diversified portfolio of customers and price points through its presence in products across multiple categories through own and third-party footwear brand (Crocs/Fitflop).
With a portfolio of 624 stores (Mar’22), Metro is looking to add 260 stores in the next three years (expansion of 40%+). METRO’s success lies in its superlative store economics. Besides advantages of high sales per square feet and high ASP, the company is also focused on keeping costs below thresholds and has industry-leading EBITDA margins of 30.5% (expanded by over 3% in the last two years).
The company sources all its products through outsourcing arrangements without its own manufacturing facility, resulting in an asset-light model. Besides, Metro has grown to be a platform of choice for other national and international third-party brands on the back of footwear-focused retailing experience. This has also been reflected through a successful partnership with Crocs, a global brand offering innovative casual footwear for women, men and children, with a focus on its moulded products and a recent deal with Fitflop. Metro continues to evaluate similar opportunities as part of active brand portfolio management. We believe Metro is well positioned to capitalise on the growing premiumization trends and increasing disposable income of people.
To summarise, here is the health of our portfolio as of Q2FY23 (with the snapshot as of September 2022)
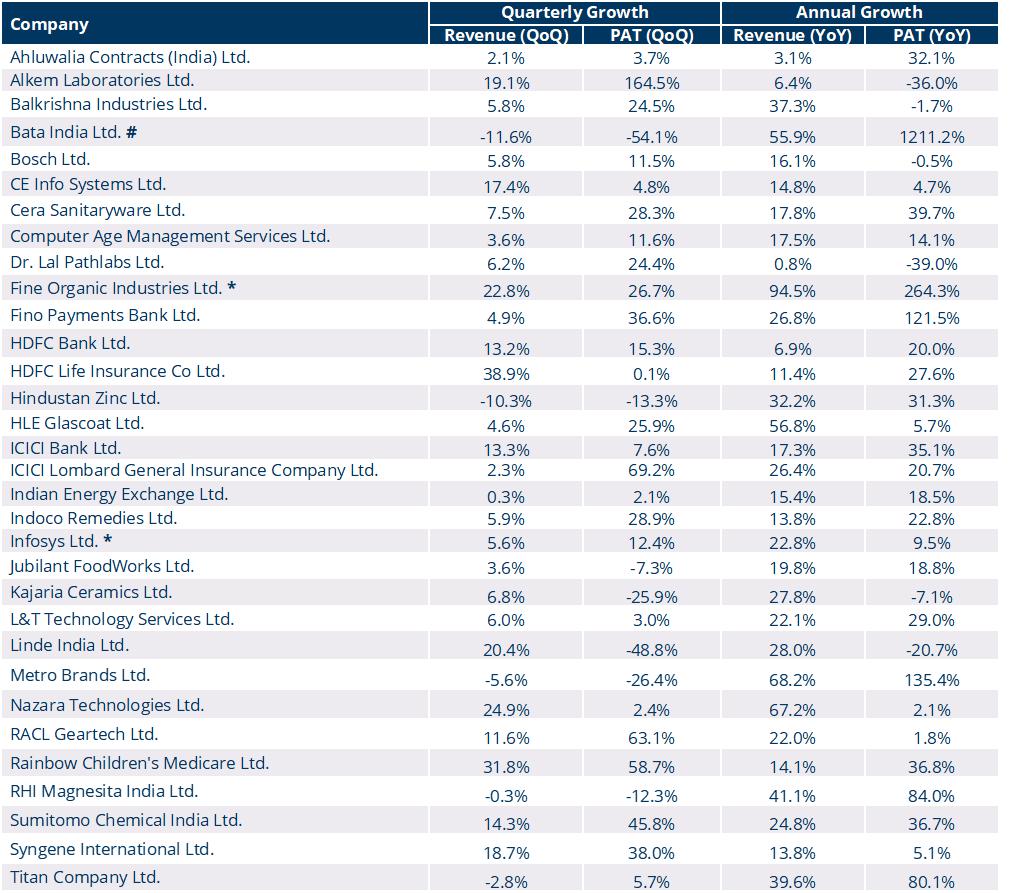
* Companies exited post Q2FY23
# Bata has been excluded from overall PAT growth as it skews portfolio-level growth
Team Itus
Disclaimer:
The performance-related information provided in this newsletter/blog is not verified by SEBI. The content is intended solely for internal circulation and general informational purposes. It does not constitute investment advice or any form of financial recommendation.
The research information shared herein may contain inaccuracies or typographical errors. All liability for actions taken or not taken based on the content of this newsletter/blog is expressly disclaimed.
No reader, user, or browser of this Newsletter / blog should act or refrain from acting based on any information in this newsletter/blog without seeking independent financial advice. Use of, and access to, this publication or any links or resources provided within do not establish a portfolio manager-client relationship between the reader, user, or browser and the authors, contributors or Itus Capital.