Reviewing Q4 FY25 at Itus (Mar’25 Earnings Quarter)
The fourth quarter of FY25 has continued characteristics of earnings as we had discussed in our previous commentaries. We had spoken about FY24 being a strong year of growth, which meant that FY25 would see a revenue growth, which would be muted due to the higher base. Around this, we wanted to ensure that our portfolio construct had characteristics of strong operating leverage (companies, who can translate the low base growth into stronger earnings and cash flows, which invariably comes from companies with strong pricing power and margin profile).
The quarter went by (March 25 – Q4FY25) saw strong annual growth in revenue and profitability across our portfolio. Growth on a YoY basis, our profitability margins grew along with robust revenue growth. There were a few interesting trends in our portfolio companies which we highlight in further detail below:

Note: For year-on-year (YoY) comparisons, we have used a rolling four-quarter format – Q4FY24 to Q4FY25 compared with Q4FY23 to Q4FY24. This approach allows us to better assess the portfolio’s growth by minimizing the impact of quarterly seasonality. Our portfolio companies continue to show steady growth and maintain healthy profitability.

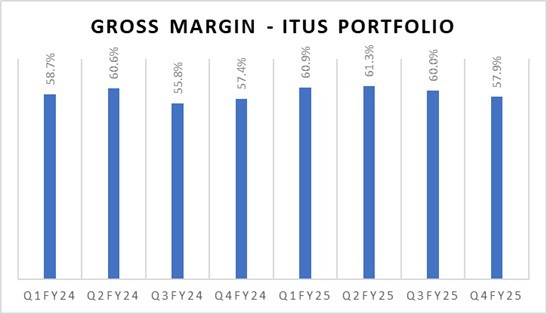
We measure the health of the portfolio to give us a summary of the earning capability of our holdings. Our Portfolio has largely maintained healthy gross margins over time – which in turn has helped our businesses accrete margins with efficiencies of scale. Keep in mind, seasonality and portfolio changes may affect Gross Margins on a quarterly basis.

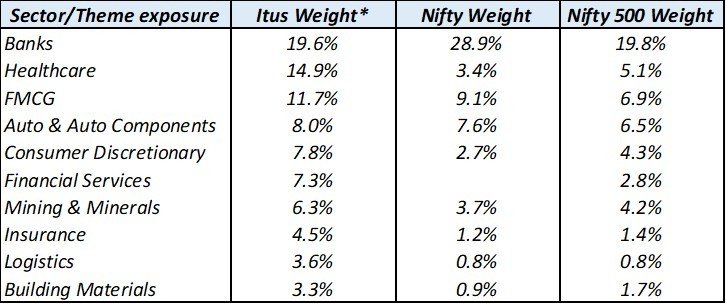
Exhibit 2: Top 10 sectors for Itus by weight against benchmarks (as on May 2025)
As we have mentioned in prior quarterly reviews, our portfolio is overweight Healthcare and Consumer, while we have trimmed exposure across the capex facing businesses. We continue to see tailwinds for growth and monitor the trends on the ground for additional channel-checks to re-validate our thesis and translate this into our positioning.
Below we highlight a few key updates and themes worth monitoring:
FMCG: Volume Growth is the Way Forward
Within the broader consumption and FMCG space, our portfolio companies continue to demonstrate strong operational momentum, with a clear outperformance in volume growth, relative to industry peers. Despite a still-evolving macro backdrop, our holdings have not only preserved market share but have also expanded it, led by effective distribution strategies, premiumization tailwinds, and strong rural recovery pockets.
Over the past several years, companies leaned heavily on price hikes to protect margins amid input cost inflation. With most categories having absorbed multiple rounds of increases, consumer tolerance for further price hikes is limited—making volume-led growth the only sustainable path forward.
Excerpts from Q4FY25 Concalls:
“Margins continue to be resilient, not because of price increase, but actually because of extensive and very sharp cost management” – Colgate Q4FY25 Concall
“A slowdown in consumption growth I think really what we see is a food inflation that continues to hurt. Only after we have exhausted procurement efficiency and cost dynamics. do we even touch pricing” – Nestle Q4FY25 Concall
Our investment strategy in this segment has focused on backing market leaders with pricing power and rural distribution depth, many of which are now benefiting from both cyclical tailwinds and structural execution strength. With inflation cooling and the consumption environment normalizing, we see a favourable setup where volume growth is poised to drive both revenue and operating leverage, rather than price hikes.
In our view, companies that can reignite volume engines while maintaining capital discipline and brand relevance will be the biggest beneficiaries in this next leg of the consumption cycle. Our portfolio remains aligned to this structural shift.
Exhibit 3: Volume Growth across Portfolio Companies
Banks: Awaiting Growth?
In the previous review, we had written about our selective preference for lenders that exhibit strength in lending growth and healthy asset quality. While we would continue to maintain a similar stance going forward and look for levers around ROA expansion, at a system level – credit growth continues to be muted at 9-10% indicating broad-based slowdown.
Exhibit 4: Credit growth at a system-level has slowed down (LTM)
Looking ahead, we expect the pressure on NIMs to persist, irrespective of the bank (Private/PSB or Large/Small). This stems from the rate cute environment (100 bps leading to possibility of 20-30 bps NIM compression) as well as higher liability side costs in being able to attract deposits.
Despite public banks having a slight advantage during rate cuts from their higher share of fixed rate book and investments, we prefer selected private banks (HDFC and ICICI) over them. This is owing to the levers of strong NII growth, lower LDR providing room for loan growth (in ICICI) and better quality of book to expand into high yield segments such as RAM (Retail, Agri and MSME). Hence, large private banks can lead to better ROA protection and expansion in this macro as per our thesis.
We believe the growth will recover as the macro environment is getting better owing to the number of steps taken by the regulator to boost system liquidity. These supportive measures are expected to continue till growth comes back. External factors seem conducive today to support growth, in terms of better currency stability, modest inflation and healthy asset quality across lenders.
In addition to the themes, we highlight the key portfolio changes we had made in the quarter.
New Addition: City Union Bank (CUB)
While MFI space continues to face headwinds from regulatory shifts and rising borrower leverage, we see positive trends in SME lending across the players. This combined with a book majorly backed by secured collateral seems to be a powerful combination of growth and asset quality. We are positioned via City Union bank (CUB) to capitalize on the tailwinds in the SME space.
Exhibit 5: City Union Bank key metrics over last 3Q
The levers for CUB today – retail contributing to growth that has historically been driven by MSME, cross-selling in segments such as housing (currently only 5% of book), appointment of Vijay Anandh, ex head of Retail Asset & Collection in RBL Bank, ability to re-price the loan book faster during time of rate cuts, healthy recoveries owing to favourable macro for Gold and Real Estate, MSME and Agri-growth exceeding industry average, strong deposit growth versus peers etc.
Exit: KEI Industries
We elucidate the framework we use to evaluate exits through the lens of KEI Industries, a leading cable & wire company, from the portfolio in the quarter ended March 2025.
At the time of exit, capacity utilization for Cables & Wires companies reached 85–90%, up from 65–70% in FY20. This increase was driven by a surge in demand and alongside the sector facing limited capacity availability during FY21–23. In response to this sustained demand, C&W companies have announced the following capex outlay for the next three years.
Exhibit 6: Capital Outlay for top Cables & Wires over next 3Y
In addition, newer entrants such as Ultratech, announced investments of 1,800 Cr. The total outlay including the above CAPEX over the 3Y period would be 9,500 Cr. Average gross asset turns (sales/assets) for the above companies over the last five years was 4.5X, implying sales of 4.5 for every 1 rupee invested.
The above investments will lead to sales potential of 42,750 Cr (9,760*4.5) at 100% capacity utilization assuming utilization levels of 70% will result in potential sales of 30,000 Cr.
The question to address was whether the industry will be able to absorb the supply?
To answer the above, we looked at the industry structure and the split between the organized and unorganized players. The size of the cable and wire industry was estimated to be 80,000 Cr, 73% of the industry was with the organized players and 27% with the unorganized companies. The industry is expected to grow by 12-13% and is expected to be 1,26,000 Cr at the end of FY28. Organized players have grown faster than the industry between 16-21% in the FY20-24 period and assuming they grow by 18-19% over the next 4 years, the organized market at the end of FY28 is expected to be 1,17,100 Cr or 93% of the market at that point, this assumes that the organized players are going to gain at the expense of the unorganized players. Trailing twelve months (TTM) sales of the above 5 companies stood at 43,608 Cr and assuming they grow by 19% over the next four years they will be able to match the supply coming into the market.
Exhibit 7: Cables & Wires – Industry growth expected towards organised
However, we see three hurdles to these companies achieving this – entry of new players like Ultratech cannot be ruled out and this will create more supply in the market. The higher double-digit growth of incumbents is at risk. Today, a key driver of revenue for cables & wires companies, is from the power sector – where we see execution delays in capitalization from Power Grid despite the company meeting the Capex requirements.
A combination of factors – execution risk at the end of power utilities, increased competition resulting in threat of incumbents continuing to growth at higher double digits led us to exit the investment.
How do we translate our outlook to positioning?
Over the last 3Y, the earnings of corporate India were strong, broad-based and this resulted in a strong ROCE accretion across Large, Mid and Smallcap.
In a market environment with potential macro headwinds, building a portfolio around margins and downside protection becomes imperative. Looking ahead, we believe earnings will increasingly concentrate among a smaller set of companies – those with pricing power and a sustainable competitive edge driven by distribution, IP, technology, or operational excellence. The below table highlights the same aspect in terms of CYTD returns.
Exhibit 8: Outperformance over N500 is from a narrow set of companies
Exhibit 9: Large Caps have seen a relatively broader outperformance
Today, the YTD (till May 2025) outperformance we are seeing from a narrow base of companies, is skewed toward Large Caps.
To summarise, the below table gives an overview of the health of our portfolio as of Q4FY25 (with the snapshot as of May 2025)
Note: The sum of above weights would not total up to 100%; remaining would be our cash holdings.
Team Itus
Disclaimer:
The performance-related information provided in this newsletter/blog is not verified by SEBI. The content is intended solely for internal circulation and general informational purposes. It does not constitute investment advice or any form of financial recommendation.
The research information shared herein may contain inaccuracies or typographical errors. All liability for actions taken or not taken based on the content of this newsletter/blog is expressly disclaimed.
No reader, user, or browser of this Newsletter / blog should act or refrain from acting based on any information in this newsletter/blog without seeking independent financial advice. Use of, and access to, this publication or any links or resources provided within do not establish a portfolio manager-client relationship between the reader, user, or browser and the authors, contributors or Itus Capital.